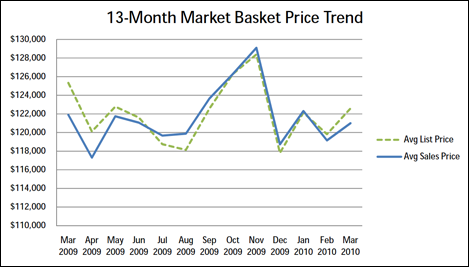
That chart illustrates sales prices for the past 13 months, as reflected in BloodhoundRealty’s Market Basket of Homes. What we’re looking at are suburban stucco and tile tract homes, the houses that drive the fat middle of the bell curve in the Metropolitan Phoenix real estate market.
That line looks awful spiky doesn’t it? That’s just the drama of charting software. What you’re really seeing is a market that is essentially flat. Prices go up. Price come back down. A home that would have sold for $122,000 in March of 2009 will have sold in March of 2010 for — wait for it — $121,000.
That’s right. For the past year, the Arizona Republic and half the faculty at ASU has been bellowing that the market has turned. It has. Slightly downward. And now that the home buyer tax credit is about to expire, it seem plausible that the near term trend will be still further downward.
Prices will probably decline gradually, mind you, and investors have clearly thrown a floor under our market. I would be surprised to see dramatic drops in values, but the segment of the chart documenting events from August through December of 2009 illustrates the impact of the tax credit. Without it, I expect this chart to grow even flatter in the months ahead.
Means what? Jump. Interest rates are still low, and cash is still king. Inventories will grow — nudging prices downward — and the quality of the available homes is gradually getting better. If you have the means to buy a home in Phoenix now, this may be the perfect storm. If we’re at the bottom, we’re going to be here for a while. But if you can afford to wait out the market, you can buy a whole lot of home for your money.
Discover more from Bloodhound Realty 602•740•7531
Subscribe to get the latest posts sent to your email.